
Author: Grace Liu ’23
Most of you living in Princeton are probably pretty familiar with Lake Carnegie, and if you’ve been in the Princeton area for a while, you may have noticed that it hasn’t been freezing over recently. In fact, the last time that Lake Carnegie froze solidly enough to allow for ice skating was over 5 years ago!

The summer after my freshman year, I researched lake freeze for my HMEI internship. Two of my mentors, Professor Vecchi and Dr. Jeevanjee, conceived this research project because they noticed that Lake Carnegie hadn’t frozen over for a few years. We wanted to see whether we could attribute this decrease in ice skating ability in recent years to climate change.
In order to answer this question, we had to take a look into the past. I wanted to figure out which years Lake Carnegie froze and which years it didn’t, so I dug into newspaper archives for mentions of ice skating or lake freezing.
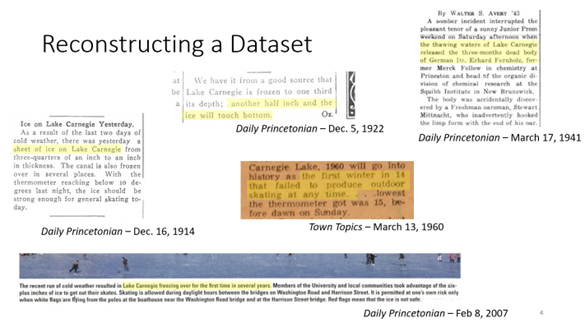
One of the most interesting findings was a newspaper from 1960 which expressed surprise that the lake didn’t freeze that year, suggesting that it was very uncommon for Lake Carnegie not to freeze back then. However, in 2007, people were surprised that the lake did freeze, instead of the other way around! These archives indicate that not only are freeze events decreasing overall, but also that climate change is actively shifting people’s expectations, from assuming the lake would freeze every year to being surprised when it does freeze.
On the plot below, we indicate every year with safe ice skating at the top and every year without safe ice skating on the bottom. The years without data are not present. The logistic regression curve shows the probability of safe ice skating in a given year, and we see that within a matter of decades, the probability of safe ice skating has decreased from 100% to 20%.
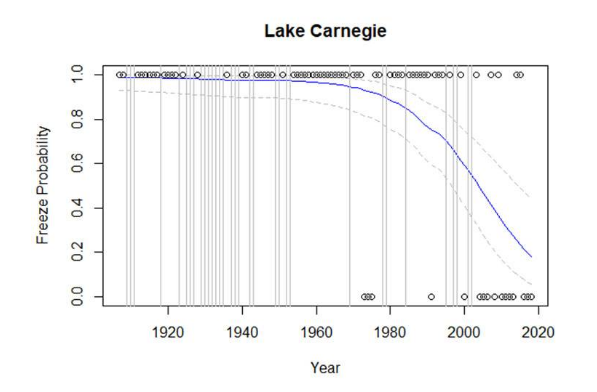
This reflects the newspapers we examined earlier, except now we’ve actually quantified the reversal of expectations. It makes sense that in the 1960s, everyone would be surprised if the lake didn’t freeze, because it had frozen almost every single year before that. Today, with a 1 in 5 chance of lake freezing, ice skating is treated as a rare and special occasion.
Overall, this was a really cool project to work on because I got the chance to use both quantitative and qualitative methods to investigate how climate change is impacting communities. I’m now a senior, and in all my time at Princeton, the lake has not been safe for ice skating. With any luck, it will freeze over this year, and I’ll finally experience the joys of skating that I’ve read so much about in the newspapers.