Author: Francesca DiMare ’23
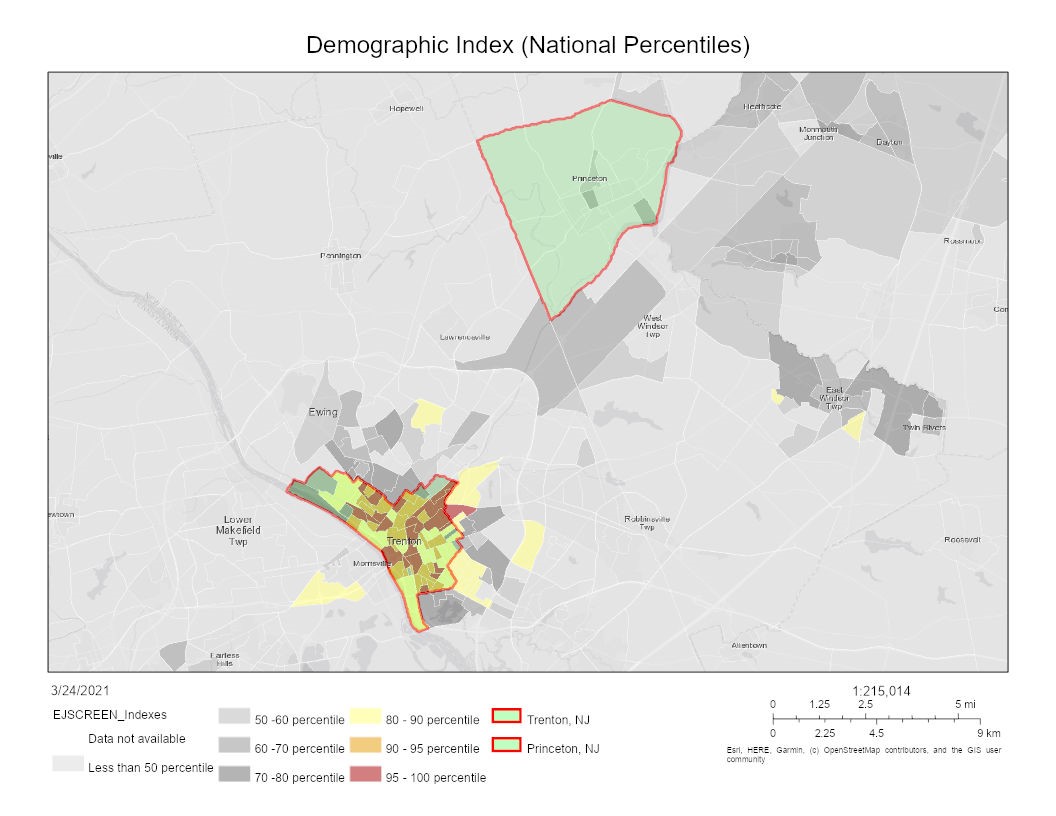
One of the defining features of environmental injustice is that disadvantaged communities often take on a disproportionate share of environmental impacts, despite not being at fault. This unfortunate trend can be seen on a very local level by comparing Trenton and Princeton. Though only a 20-minute drive apart, these two communities have tremendously different levels of privilege and share very different levels of environmental burden. This post will use US Census Data and the EPA’s EJSCREEN – a tool designed to facilitate environmental justice mapping and screening – to explore this trend.
The difference between the number of people of color and the median income in Princeton and Trenton is stark. Some key statistics, including the percentage of Black or African American people, the percent of people of Hispanic or Latino origin, the percent of persons in poverty, and the median family income, have been summarized in the table below.
Princeton and Trenton Demographic Comparison
| Princeton | Trenton | |
| Black or African American, percent | 5.7% | 49.5% |
| Hispanic or Latino, percent | 7.5% | 38.1% |
| Persons in Poverty, percent | 7.8% | 28.7% |
| Median Family Income | $137,672 | $35,402 |
As seen above, Trenton has more than 8 times a greater Black population than Princeton, and nearly 1/4th the median family income. Unfortunately, it is communities like Trenton that are low income and underrepresented populations which often face the brunt of negative environmental impacts.
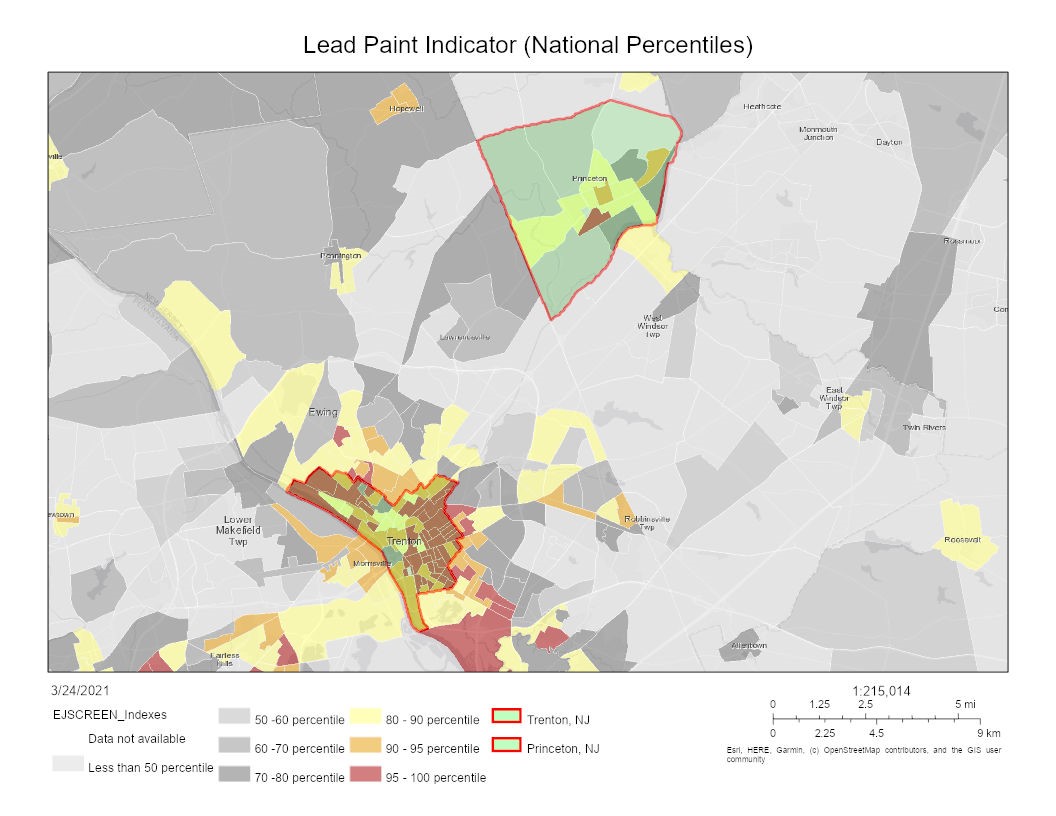
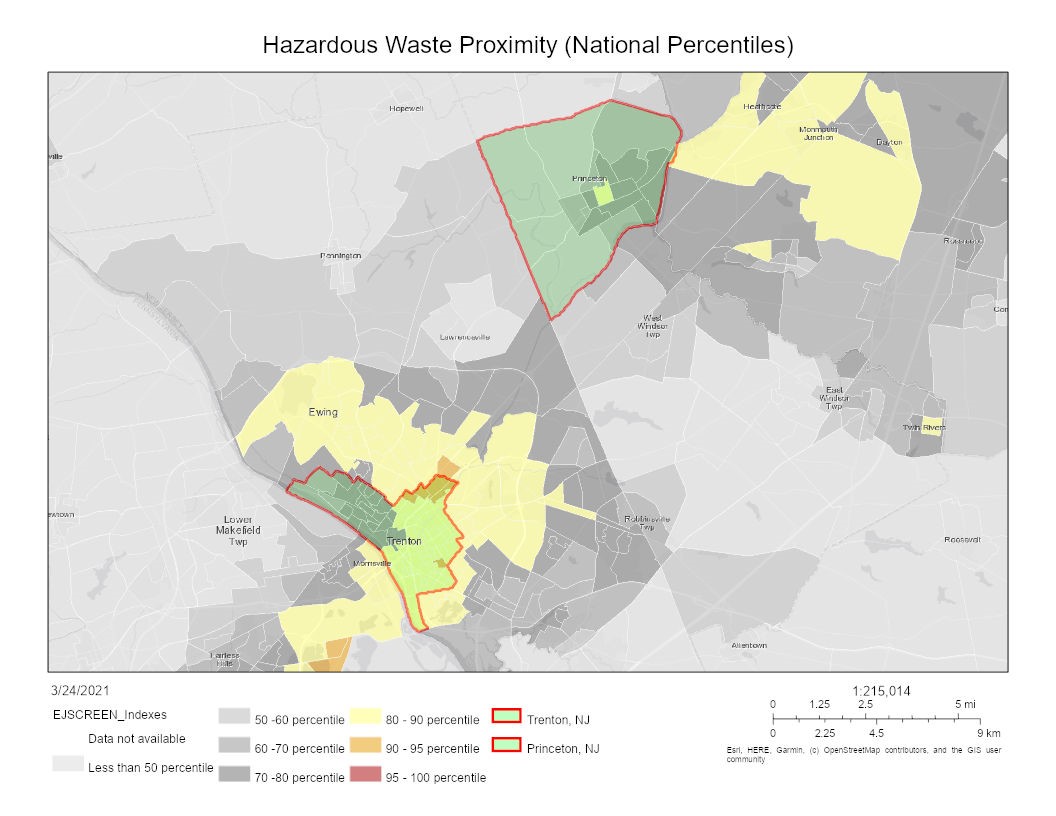
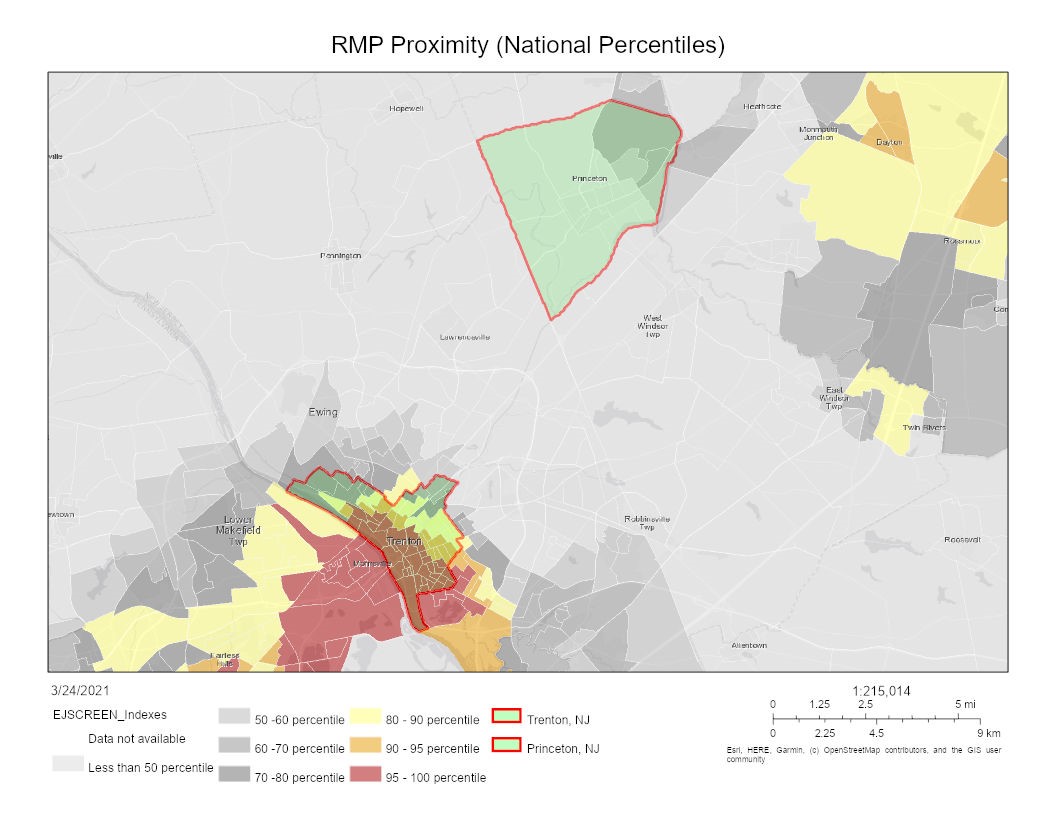
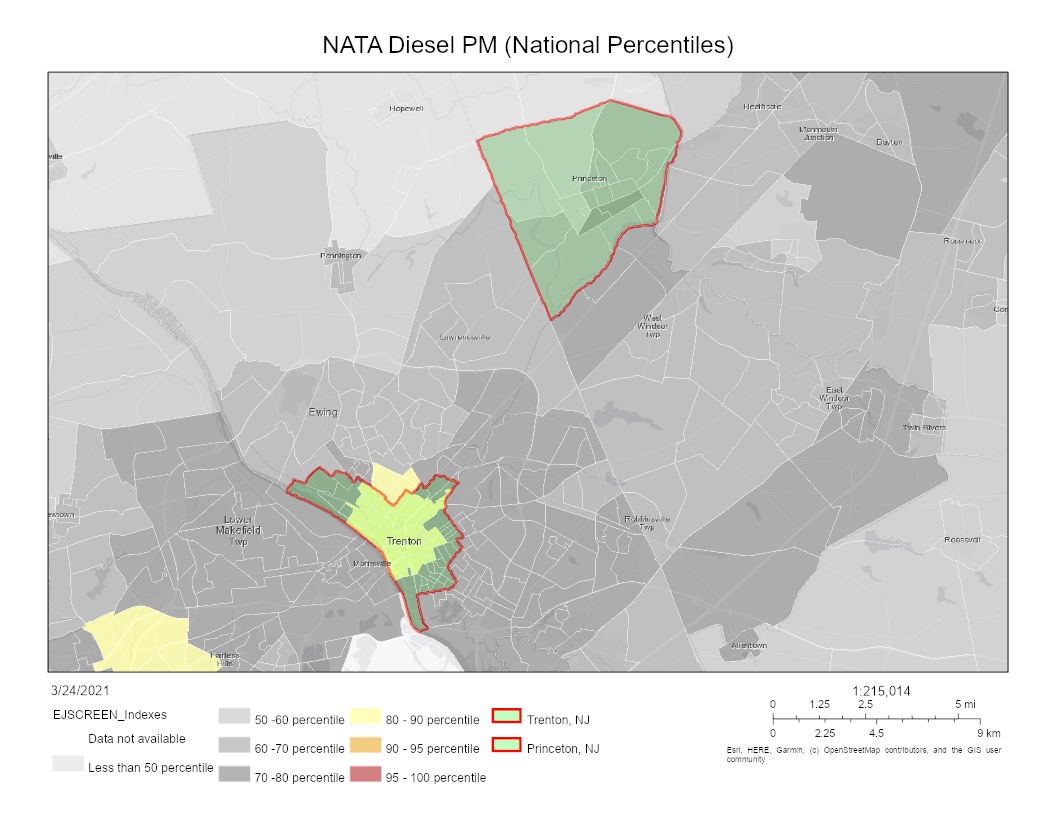
EJSCREEN pools publicly available data to explore the intersection of environmental and demographic indicators. Of the program’s 11 environmental indicators, 5 revealed immediately visible differences between Princeton and Trenton. I generated maps to highlight these differences, which can be viewed in full at the end of the document.
In short, Trenton residents face an increased potential for lead exposure, an increased risk of being exposed to an accidental chemical release, higher levels of diesel particulate matter in the air, increased negative impacts of living near highly trafficked roads, and an increased chance of encountering hazardous waste due to proximity to a hazardous waste treatment facility. Additional information on these environmental indicators can be found in the technical documentation for EJSCREEN.
All of the disproportionate environmental burdens mentioned are associated with adverse health effects, such as increased risks of cancer, cardiovascular disease, neurological damage, and more.
Unfortunately, Princeton University is not guiltless when it comes to this environmental justice issue. The waste we produce across campus is sent to the Trenton area landfill, and our tiger transit buses are stored in Trenton overnight without servicing any communities along the way. In this way, we are directly contributing to the disproportionate environmental burden between Princeton and Trenton. To Princeton students, waste magically disappears after it is thrown down a trash chute or collected by Facilities staff. Unfortunately, this is not the case for the people who live near these landfills and must face all associated environmental and health impacts directly – even when it is not their waste.
As the university rapidly develops and expands, it is becoming increasingly urgent to recognize and address our shortcomings when it comes to environmental justice. We should be supporting and uplifting nearby communities – not standing in their way.
There is undoubtedly a long way to go in tackling the disproportionate environmental impacts faced by underrepresented communities. The Office of Sustainability recently released a draft environmental justice framework, which lays out short- and long-term action items for addressing environmental justice issues. The framework also invites feedback from all members of the campus community. This call to action is a start, but we are only at the beginning of a very long road, and making progress will require many different perspectives.